

Translate this page into:
Tracking of Financial Burden: A Longitudinal Study of Out-of-Pocket Expenditure (OOPE) among Rural Households with Hypertension (HTN)
Address for correspondence Nanjesh Kumar Siddappa, MBBS, MD (Community Medicine), Department of Community Medicine, K. S. Hegde Medical Academy, Nitte (Deemed to be University), Deralakatte, Mangalore, Karnataka 575018, India (e-mail: hod.commed.kshema@nitte.edu.in).
This article was originally published by Thieme Medical and Scientific Publishers Pvt. Ltd. and was migrated to Scientific Scholar after the change of Publisher.
Abstract
Objectives
The study aimed to determine the monthly expenditure pattern and out-of-pocket expenditure (OOPE) associated with managing hypertension in households with patients with hypertension in a rural community in Karnataka, India.
Materials and Methods
A longitudinal study was conducted over a period 6 months in a rural community under a rural primary health center in Karnataka. One hundred and one households were included in the study with at least one member diagnosed with hypertension. Household incomeand othersociodemographicvariableswerealso recorded to assess the economic impact relative to household resources. Monthly spending on nonhealth essentials and hypertension-related OOPEs revealed significant financial strain on households.
Statistical Analysis
Descriptive statistics were used to summarize the study of population's demographic characteristics, monthly expenditure in nonhealth essentials, and OOPE. Inferential statistics of Friedman and chi-square tests (Fischer's exact) were used to determine factors associated with OOPE.
Results
The population's median age was 59.1 ± 12 years, with a median of 5 (3–10) years since diagnosis with hypertension. Micro to macro vascular complications related to hypertension were present in 17 (22.66%), and 13 (24.52%) were admitted to the hospital in the past 1 year/for 6 months' follow-up. Seventy-two (71.30%) had a monthly OOPE on health (INR) of ≥ 500. Higher socioeconomic status and visits to private health facilities for hypertension treatment were associated with higher OOPE.
Conclusion
Monthly expenditure among households with patients with hypertension in the rural community shows no significant variation for nonhealth essential items. Higher OOPE was associated with households having higher socioeconomic status and visits to private health facilities for treatment of hypertension.
Keywords
economic status
health expenditures
health facilities
hypertension
rural population

Introduction
High blood pressure, or HTN, is a major global health concern and one of the main causes of cardiovascular morbidity and death.1 In countries with low and middle income, health systems frequently find it difficult to control chronic disease-related treatment and lifestyle modifications seen in HTN.2 In India, HTN is gradually increasing in rural and urban populations, especially among the rural population. Treating HTN poses unique issues for rural communities because of financial barriers, lack of awareness, and limited access to health care.3 These factors worsen the health and financial ill-effects of HTN by contributing to underdiagnosis and undertreatment among the rural population. The prevalence of HTN has been steadily increasing in rural India, which is in line with more general epidemiological changes.4 A recent systematic review disclosed that 12% of the studies showed poorer HTN control among rural patients than urban patients.5 The prevalence was slightly higher in urban areas at 12.5% (12.25-12.80%) than in rural areas at 10.6% (10.50–10.78%).6 Despite this heavy burden of HTN, rural communities frequently lack the health care infrastructure to screen for, diagnose, and treat HTN adequately.7 Inadequate health care access and low health literacy lead to poor disease management, higher complications, and financial strain in rural families, causing poverty and catastrophic health expenditures.8
HTN in India significantly impacts households, leading to high expenses and productivity loss. Socioeconomic (SE) inequality contributes to higher medical costs among low-er-income households.9 Planning treatments and strategies for the prevention and control of HTN requires understanding the SE disparities in the diagnosis and treatment of HTN, especially among the rural population.10 A review study published in 2019 has suggested that the greatest loss of income among noncommunicable diseases (NCDs) was attributed to HTN, followed by diabetes and cardiovascular diseases–the NCDs lower gross domestic product, resulting in productivity losses and significant macroeconomic im-pact.11 Another study in Mumbai's Malwani slum revealed that managing HTN and related disorders costs around ₹7,154 annually, with government and private health care costs averaging ₹6,073 and ₹8,235, respectively.12 However, rural community-based studies lack information on out-ofpocket expenditure (OOPE) for treatment and hospitalization among patients with HTN in India. The current study aimed to assess the monthly expenditures on essential household needs like food, electricity, and liquefied petroleum gas (LPG) and determine the OOPE among patients with HTN in a rural community in Karnataka, India.
Methodology
Study Tool
A pretested semistructured questionnaire collected baseline information on household characteristics, income, and medical history linked to HTN. Moreover, monthly spending on food-related monthly expenditure, education-related monthly expenditure, electricity/water amenities, LPG expenditure, and recreation-related expenditure was gathered to track alterations and tendencies in household spending patterns linked to HTN. Two subject experts in community medicine did validation and feedback was incorporated into the questionnaire before the commencement of the pilot study. This study was part of a larger study involving other NCD conditions like diabetes and both HTN and diabetes.
Data Collection
A longitudinal study was conducted in a rural community under a rural primary health center (PHC) in a coastal district of Karnataka between 2019 and 2022.
Accredited Social Health Activists workers were contacted in person to identify the households with HTN patients in the PHC area. The study was focused on households having at least one member diagnosed with HTN and who was put on treatment for at least 1 year before the data collection. In case there was more than one individual with comorbid NCDs of diabetes and both HTN and diabetes, the individuals with HTN were considered separately for estimating the financial burden and OOPE, especially if both have different patterns of health care utilization or varying costs associated with their treatment. These rural residents had a domicile in the study area for at least 6 months. Consenting adult patients willing to participate in the study and provide financial data were recruited consecutively till the required sample size was achieved. The households with HTN patients who were unavailable to the investigator, even after two informed visits, were excluded. In case monthly visits were not possible due to coronavirus disease pandemic travel restrictions, telephonic interviews were employed to collect data, thereby ensuring lower participant attrition.
Additionally, a medical records review was conducted on the study participants to ascertain medical records, including financial details on medication, frequency of medical visits to both outpatient departments of health care facilities, and any in-patient hospitalizations in up to 1 year. Monthly follow-up visits to the households were conducted to track monthly expenditures for essential household needs (food, electricity, LPG, and others) and any incidental health care expenditures for patients with HTN were noted.
Sample Size Calculation
The sample size was calculated based on the study done in Malwani slum, where the OOPE among HTN patients was estimated to be 34.2%.12 The estimated minimum sample size of 87 was determined to estimate the expected proportion with 10% absolute precision and 95% confidence using a Statulator.13
Operational Definitions Used in the Study
Complications in HTN: HTN complications, like myocardial infarction, stroke, heart failure, chronic kidney disease, and peripheral artery disease, result from sustained high blood pressure.14
Health-related OOPE: Health care expenses, including medical consultations, medications, and hospital stays, that were directly paid by individuals or households, excluding reimbursable insurance payments or third-party payers, reflecting the financial burden of health care.15
Food-related monthly expenditure: The total monthly spending a household does for food and beverage items for human consumption, including groceries, dining out, takeout, and special occasions.16
Education-related monthly expenditure: A household's total spending on education-related goods and services, including tuition fees, school supplies, transportation, extracurricular activities, tutoring, and other expenses related to formal or informal education.17
Electricity/water amenities: The monthly expenditure for electricity/water amenities includes charges for consumption, water usage, fixed fees, taxes, and other associated costs, not including installation or repair of infrastructure.
LPG expenditure: LPG-related monthly expenditure refers to a household's monthly expenditure on LPG for cooking and heating, including costs for cylinders, transportation, and additional charges.18
Recreation-related expenditure: It is the monthly spending of the patients on leisure activities and services, including gym memberships, fitness classes, sports equipment, hobbies, and entertainment events. This expenditure affects HTN management, considering both direct and indirect costs.19
Ethical Considerations
Before collecting participant data, participants were provided with an information sheet on the study protocol and the need for follow-up visits to measure trends and expenditure patterns. Then, each participant was asked to sign a written informed consent form. All gathered information was kept private and utilized exclusively for the study. Before statistical analysis, the final data set's identifiable data was anony-mized. The Institution's Central Ethics Committee (CEC) granted study permission via letter NU/CEC/2019/0241, dated June 13, 2019.
Statistical Analysis
Data thus collected were entered into MS Excel and analyzed using SPSS Version 29.0. Descriptive statistics of age, gender, income level, and baseline expenditures were summarized using median and interquartile range (IQR). The monthly expenditure data on food, electricity, and LPG over the 6 months were analyzed to identify any significant changes or patterns in nonhealth essential items. Inferential statistics of chi-square tests were used to determine changes in monthly expenditure patterns and factors significantly associated with OOPE among HTN patients.
Results
Sociodemographic Description of the Study Population
46 (45.54%) of the 101 adult consenting patients with hypertension were 61 years or older. The median age of the study population was 59.1 ± 12 years, as seen in Table 1. Most participants are married, with a significant proportion of unmarried or widowed individuals. Most households have two or more earning members and a low frequency of complications related to HTN, suggesting manageable HTN. Most participants have not been hospitalized for HTN-related issues, suggesting better access to health care facilities. The study participants also showed that over half of the participants have been living with HTN for 5 years or less, with a median of 5 (3–10) years since the diagnosis of HTN.
| Socio-characteristics | Variables | Frequency, n (%) | |
|---|---|---|---|
| Age group (in years) | ≤ 40 | 7(6.93) | |
| 41–50 | 22 (21.78) | ||
| 51–60 | 26 (25.74) | ||
| ≥ 61 | 46 (45.54) | ||
| Educational status | No formal education | 25 (24.8) | |
| Primary to secondary school | 66 (65.3) | ||
| PUC and above | 10 (9.9) | ||
| Marital status | Married | 76 (75.24) | |
| Unmarried/widow/widower | 25 (24.75) | ||
| Sex | Male | 47 (46.53) | |
| Female | 54 (53.46) | ||
| Earning members in the family | 0–1 | 43 (42.57) | |
| ≥ 2 | 58 (57.42) | ||
| Socioeconomic status as per Modified BG Prasad | classification20 | Upper class | 11 (10.9) |
| Upper middle | 29 (28.7) | ||
| Middle | 39 (38.6) | ||
| Lower middle | 20 (19.8) | ||
| Lower | 2(2) | ||
| Complications related to hypertension | Yes | 17 (22.66) | |
| No | 84 (83.16) | ||
| Admitted to hospital in the past 1 year/for 6 months’ follow-up | Yes | 13 (24.52) | |
| No | 88 (87.12) | ||
| Duration of hypertension diagnosis (in years) | < 5 | 53 (52.47) | |
| > 6 | 48 (47.52) | ||
| Health insurance of any type | Present | 39 (38.6) | |
| Absent | 62 (61.4) | ||
| Monthly out-ofpocket expenditure on health (INR) | ≥ 500 | 72 (71.30) | |
| ≤ 499 | 29 (28.7) | ||
| Number of households with more than one comorbidity | Present | 5 (5.0) | |
| Absent | 96 (95.0) |
Abbreviations: INR, Indian rupees; PUC, pre-university course.
Note: Bold represents the highest percentage.
Monthly Expenditure Patterns of the Households in the Study Population (N = 101)
Table 2 shows the self-reported average monthly expenditure on food was ₹3,187, suggesting stable spending despite financial pressures from managing HTN. Education expenses remain constant at ₹1,000 per month, and LPG expenses are fixed at ₹750 per month, indicating a stable cost. Recreation expenditures show variability, with an average of ₹683, suggesting discretionary spending adjustments. Essential household expenditures like food, education, electricity, and LPG remain stable despite financial strain. Recreation expenses show more variability, suggesting households prioritize these areas, potentially at the expense of flexibility in other budget categories. Understanding these patterns can help assess HTN's impact on financial planning and guide interventions for financially burdened households in rural settings. The monthly expenditure patterns, however, did not show any significant variations in expenditures related to the nonhealth essential items of the households with patients with HTN.
| Particulars | Median and interquartile range (IQR) of variables in months | Chi-square table value | p-value | |||||
|---|---|---|---|---|---|---|---|---|
| 1st | 2nd | 3rd | 4th | 5th | 6th | |||
| Food | 3,125 | 3,208 | 3,200 | 3,164 | 3,154 | 6.041 | 0.302 | |
| (2,500–3,710) | (2,450–3,825) | (2374.5–3,925) | (2,475–3,861.5) | (2,421.5–3,982.5) | (2,423–3945) | |||
| Education | 1,000(625–1,500) | 1,000(625–1,500) | 1,000(625–1,500) | 1,000(625–1,500) | 1,000(625–1,500) | 1,000(625–1,500) | 1,000 | – |
| Electricity/ water amenities | 597(414–794) | 589(420–767.5) | 587(437.5–766.5) | 591(424.5–754) | 600(423.5–765) | 5.695 | 5.695 | 0.337 |
| LPG | 750(700–850) | 750(700–850) | 750(700–850) | 750(700–850) | 750(700–850) | 750(700–850) | 1,000 | – |
| Recreation | 700(500–1,150) | 750(500–1,050) | 750(500–1,000) | 750(500–1,000) | 750(500–1,100) | 750(500–1,000) | 0.506 | 0.992 |
| Medical expenses | 475(500–1,150) | 475(500–1,050) | 475(500–1,000) | 475(500–1,000) | 482(500–1,100) | 482(500–1,000) | 59.65 | 0.001a |
Abbreviation: LPG, liquefied petroleum gas
Note: Bold represents the highest percentage.
The median food expenditure of ₹2,000, with an IQR ranging from ₹1,000 to ₹3,000, indicates that households spend a significant portion of their budget on food. The wide range suggests that household food costs vary considerably, potentially influenced by family size, dietary needs, and local food prices. This expenditure is a substantial component of the household budget, reflecting a relatively stable necessity despite other financial pressures. The time series plot, as seen in Fig. 1, analyzed the variations in the population's health expenditure and nonhealth expenditures. As seen in Fig. 1, stable categories like education, LPG, and electricity/water showed minimal changes over time, while variable categories like food showed small fluctuations, indicating external factors influencing household spending.
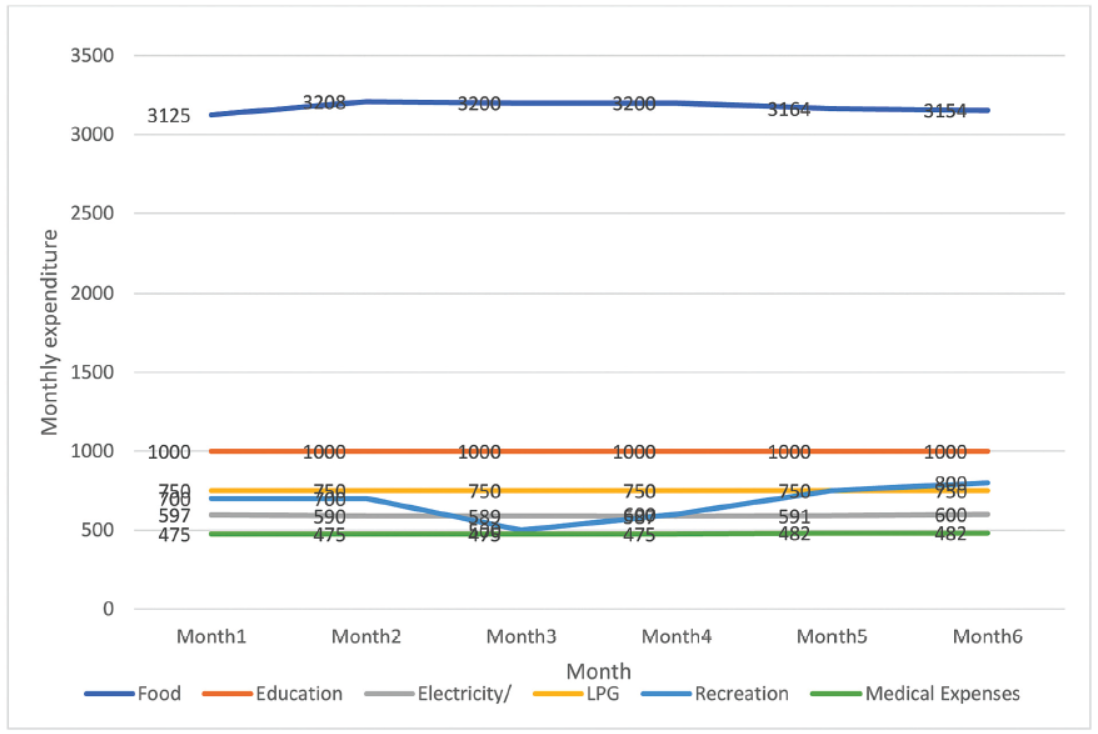
- Median monthly expenditures of households over a 6-month period (N = 101).
Factors Associated with Monthly OOPE
Table 3 shows the factors associated with monthly OOPE in the study population. The higher OOPE was significantly associated with visits to private health care facilities and SE status. Lower OOPE was significantly associated with visits to government facilities like the nearby PHCs.
| Characteristic | Variables | Monthly out-of-pocket expenditure in INR n (%) | Chi-square value | p-Value | |
|---|---|---|---|---|---|
| ≤ 499 | ≥ 500 | ||||
| Age group (in years) | ≤ 50 | 7(24.1) | 22 (75.9) | 0.416 | 0.63 |
| ≥ 51 | 22 (30.6) | 50 (69.4) | |||
| Highest level of education | Up to primary | 22 (29.3) | 53 (70.7) | 0.055 | 0.815 |
| Above primary | 7 (26.9) | 19 (73.1) | |||
| Marital status | Married | 20 (26.3) | 56 (73.7) | 0.862 | 0.445 |
| Others | 9 (36.0) | 16 (64.4) | |||
| Earning members in the family | 0–1 | 12 (27.3) | 32 (72.7) | 0.079 | 0.779 |
| > 2 | 17 (29.8) | 40 (70.2) | |||
| Socioeconomic statusb | Higher (class I and II) | 6 (15.0) | 34 (85.0) | 6.08 | 0.015a |
| Lower (class III, IV, and V) | 23 (37.7) | 38 (62.3) | |||
| Health insurance (any type) | Present | 9 (31.0) | 30 (41.7) | 0.986 | 0.321 |
| Absent | 20 (69.0) | 42 (58.3) | |||
| More than one comorbidity in the household | Present | 2 (6.9) | 3 (4.2) | 0.327 | 0.567 |
| Absent | 27 (93.1) | 69 (95.8) | |||
| Years since being diagnosed with hypertension | ≤ 5 | 20 (37.7) | 33 (62.3) | 4.43 | 0.035a |
| ≥ 6 | 9 (18.8) | 39 (81.3) | |||
| Medicines purchased from | Government health facilities/primary health centers | 24 (54.5) | 20 (45.5) | 25.4c | ≤ 0.001a |
| Others | 5 (8.8) | 52 (91.2) | |||
| Private health facilities | 14 (17.5) | 66 (82.5) | 23.63 | < 0.001a | |
| Others | 15 (71.4) | 6 (28.6) | |||
| Generic medicine stores | 10 (40.0) | 15 (60.0) | 2.068 | 0.202 | |
| Others | 19 (25.0) | 57 (75.0) | |||
Abbreviation: INR, Indian rupees.
Note: Bold represents highest percentage.
Discussion
The current study findings reveal that health-related expenditures are significantly higher for hospitalization and medicine purchases from the pharmacy. Monthly expenditures are highest for food among households with patients with HTN when compared with other amenities like electricity, LPG, and recreation purposes. Household financial management is influenced by fixed expenses like education and utility costs, but discretionary spending can be adjusted to cope with unforeseen medical or essential costs. Households with HTN patients experience significant OOPEs associated with visits to private health care facilities and the SE status of the households of the patients with HTN irrespective of the age group, level of education, marital status, and the number of earning members in the family. Lower OOPEs were associated with visits to government health facilities like the nearby PHCs.
Financial Impact on Essential Expenditures
The high cost of essential items such as food, electricity, and LPG exacerbates this financial burden with almost similar spending patterns in the population on medicines among households with HTN. This finding aligns with previous research that highlights how chronic illnesses like HTN disproportionately affect low-income households, as seen in the study by Patel et al, which found households with chronic illnesses in rural India often experience reduced spending on necessities due to high medical expenses.21
The study contrasts with a study conducted on the National Sample Survey in India in 2018, which showed that elderly adults from higher SE status and financially independent individuals incurred higher OOPE compared with those who were partially or fully economically dependent as there were no association found with OOPE of more than 500 INR with gender, age, marital status, and educational level.22
Health Care Expenditures and Its Implications
The average monthly expenditure on HTN-related health care was found to be at par with nonhealth care essentials. The findings align with the study using the National Sample Survey estimates of 2017–18 in India, where the outpatient consultation charges for HTN related to outpatient visits in public facilities ranged from INR 277 (standard deviation [SD] 571) to INR 695 (SD 1,431) depending on the type of private hospital/clinic, similar to our study.23 The study findings contrast the study conducted by Ramanna et al, where the mean expenditure among households with patients with HTN was 1,464, which was much higher compared with the current study.24 The study contrasts the high expenditure seen in the average annual basic household expenditure in the Philippines, which is $12,255.59, with the HTN-attributable OOPE of $147.75, which was seen in approximately 23.7% of the households, primarily for nonmedical expenses like dietary requirements and transportation to health care consultations, which were significantly lower with a median expenditure of 100 to 1,500 INR and more than 72 (71.30%) of the households with HTN patients spending more than INR 500 per month on medicines as seen in Tables 2 and 3.25
Other studies conducted in Nigeria also showed higher expenditure patterns among those with HTN, that is, N36,814 (INR 1,900). These costs included the average monthly cost of controlling HTN, where laboratory tests and medications accounted for the largest portion of this expense. A similar study conducted among those who attended the outpatient departments for treatment of HTN in Egypt incurred a direct OOPE of 682.4 ± 283.8 Egyptian pounds (∼1,175.58 INR), which was higher when compared with the present study finding.
Impact on Nonessential Expenditures
Research suggests that managing HTN in households reduces spending on nonessential items due to substantial out-ofpocket costs and economic strain. In the current study, the households with HTN patients' variable spending on recreation reflect the prioritization of medical expenses over quality-of-life enhancements. The current study findings align with a research in Sri Lanka, which found that households with chronic NCD patients face higher OOPEs for medicines, pharmaceutical products, medical laboratory tests, and ancillary services.26
Limitations
The study on HTN's financial burden has limitations due to its focus on a single rural community, suggesting that future research should include a diverse sample and additional variables for a more comprehensive understanding. Future research should explore these issues and provide evidence-based recommendations for mitigating chronic diseases' financial impact.
Conclusion
Monthly expenditure among households with patients with HTN in the rural community shows no significant variation for nonhealth essential items. Higher OOPE was associated with households with higher SE status and visits to private health facilities for treatment of HTN.
Conflict of Interest
None declared.
References
- Global health: chronic dis?eases and other emergent issues in global health. Infect Dis Clin North Am. 2011;25(03):623-638.:ix-638.
- [Google Scholar]
- Hypertension in India: a systematic review and meta-analysis of prevalence awareness, and control of hypertension. J Hypertens. 2014;32(06):1170-1177.
- [Google Scholar]
- Prevalence and predictors of hypertension: evidence from a study of rural India. J Family Med Prim Care. 2022;11(03):1047-1054.
- [Google Scholar]
- Hypertension control rate in India: systematic review and meta-analysis of population- level non-interventional studies 2001-2022. Lancet Reg Health Southeast Asia. 2022;9:100113.
- [Google Scholar]
- Prevalence and associated risk factors of hypertension among persons aged 15-49 in India: a cross-sectional study. BMJ Open. 2019;9(12):e029714.
- [Google Scholar]
- Accessed August 23, 2024 at:
- [Publisher]
- American Heart Association Council on Epidemiology and Prevention; Council on Cardiovascular Disease in the Young; Council on Cardiovascular and Stroke Nursing; Council on Peripheral Vascular Disease; Council on Quality of Care and Outcomes Research; and Stroke Council. Health literacy and cardiovascular disease: fundamental relevance to primary and secondary prevention: a scientific statement from the American Heart Association. Circulation. 2018;138(02):e48-e74.
- [Google Scholar]
- The economic burden of cardiovascular disease and hypertension in low- and middle-income countries: a systematic review. BMC Public Health. 2018;18(01):975.
- [Google Scholar]
- Comparing socio-economic inequalities in self-reported and undiagnosed hyper-tension among adults 45 years and over in India: what explains these inequalities? Int J Equity Health. 2023;22(01):26.
- [Google Scholar]
- A review on non- communicable diseases (NCDs) burden, its socio-economic impact and the strategies for prevention and control of NCDs in India. Indian J Public Health. 2018;62(04):302-304.
- [Google Scholar]
- Economic burden of Hypertension care on households of Malwanislum of Mumbai: a cross-sectional study. Int J Res Med Sci. 2015;3(09):2376-2381.
- [Google Scholar]
- 2024 Statulator: An online statistical calculator Statulator Accessed August 24 at:
- [Publisher]
- 2017 ACC/AHA/AAPA/ABC/ACPM/AGS/APhA/ASH/ASPC/NMA/PCNAguideline for the prevention, detection, evaluation, and management of high blood pressure in adults: a report of the American College of Cardiology/American Heart Association Task Force on Clinical Practice Guidelines. Hypertension. 2018;71(06):e13-e115.
- [Google Scholar]
- Health care costs structures and trends In: International Encyclopedia of Public Health. Elsevier; 2008. p. :153-160. In
- [Google Scholar]
- Household dietary diversity and food expenditures are closely linked in rural Bangladesh increasing the risk of malnutrition due to the financial crisis. J Nutr. 2010;140(01):182S-188S.
- [Google Scholar]
- Measuring Household Expenditure on Education; A Guide-book for Designing Household Survey Questionnaires. World Bank; 2018:42. Accessed August 28, 2014 at:
- [Publisher] [Google Scholar]
- Liquefied petroleum gas access and consumption expenditure: measuring energy poverty through wellbeing and gender equality in India. Sustainability. 2024;16(08):3413.
- [Google Scholar]
- Income and expenditure patterns in recreation and leisure in Costa Rica (Patrones de ingresos y gastos en recreacion y ocio en Costa Rica) Retos. 2015;(27):188-192.
- [Google Scholar]
- Updated B. G. Prasad scale for socioeconomic status classification for the year 2024. Indian J Pediatr. 2024;91(06):643.
- [Google Scholar]
- Chronic disease concordance within Indian households: a cross-sectional study. PLoS Med. 2017;14(09):e1002395.
- [Google Scholar]
- Gender differentials in out-of-pocket health expenditure among older adults in India: evidence from National Sample Survey 2014 and 2018. Ageing Int. 2022;47(04):779-800.
- [Google Scholar]
- Out-of-pocket expenditure in hypertension related care in India: estimates from National Sample Survey 2017-18. Asia Pac J Health Manag 2023 Doi: 10.24083/apjhm.v18i2.1763
- [Google Scholar]
- Burden of therapy in patients suffering from diabetes mellitus and hyper-tension. Int J Pharm Pharm Sci. 2017;9(05):210.
- [Google Scholar]
- Out-of-pocket expenditure for hypertension care: a population-based study in low-income urban Medellin Colombia. Glob Health Action. 2020;13(01):1806527.
- [Google Scholar]
- Impacts of chronic non-communicable diseases on households out-of-pocket healthcare expenditures in Sri Lanka. Int J Health Econ Manag. 2018;18(03):301-319.
- [Google Scholar]