

Translate this page into:
A Comparative Study of Peripheral Smear Findings with RBC Indices and Automated Analyzer Generated RBC Histograms in the Diagnosis of Anemia's
Address for correspondence Shilpa Manigatta Doddagowda, MD, Department of Pathology, Sri Devaraj Urs Medical College, Tamaka, Kolar 563103, Karnataka, India (e-mail: mdshilpa@gmail.com).
This article was originally published by Thieme Medical and Scientific Publishers Pvt. Ltd. and was migrated to Scientific Scholar after the change of Publisher.
Abstract
Introduction
The red blood cell (RBC) indices generated by cell counters help in the morphological classification of anemia. The importance of microscopic examination of peripheral blood smears (PBSs) stained by Leishman stain cannot be used alone when it comes to interpretation of the underlying cause of anemia. Hence, all three RBC histograms, indices, and microscopic examination of PBSs are very essential for a complete assessment of anemia.
Aims and Objectives
To diagnose the type of anemia by examination of PBSs, automated cell-generated RBC histograms, and RBC indices and to compare and correlate the findings of RBC indices and automated cell-generated RBC histograms with PBS examination.
Materials and Methods
This was a prospective comparative study done on 500 cases of anemia for a period of 5 months from August 2023 to December 2023 in a rural tertiary care teaching hospital and all the patients' RBC indices, RBC histogram findings, and PBS findings were noted and analyzed.
Results
Among 500 samples, normocytic normochromic anemia consists of the majority of the cases 272 (54.4%), followed by microcytic hypochromic anemia cases 183 (36.6%), macrocytic anemia cases 27 (5.4%), normocytic hypochromic anemia were 10 (2%) cases, and dimorphic were 8 cases (1.6%). When compared with RBC histogram, 265 (53.0%) cases showed normal bell-shaped curve, 188 (37.6%) cases showed left shift, 27 (5.4%) cases showed broad based curve, 10 (2%) cases showed right shift, and 10 (2%) cases showed bimodal curve suggesting normocytic normochromic, microcytic hypochromic, normocytic hypochromic anemia, macrocytic, and dimorphic anemia, respectively.
Conclusion
This study showed a well correlation in the findings of the automated hematology analyzer with the microscopic examination. Histogram alone could be used as a screening method but when combined with RBC indices and PBS findings, they act as useful supplements and by correlating findings of all three, we could diagnose the majority of anemia.
Keywords
microcytic hypochromic
macrocytic
left shift
right shift

Introduction
Anemia is the most common health problem all over the globe especially in India. There is a significant association of anemia with morbidity and mortality. Anemia is a condition where the oxygen-carrying capacity is reduced in the blood which leads to tissue hypoxia. The World Health Organization (WHO) states that worldwide anemia affects 1.62 billion people which corresponds to 24.8% of the world population.1
Laboratory investigations such as the complete blood count (CBC) and differential white blood cell (WBC) count are crucial in diagnosing anemia. By these parameters, we can also diagnose platelet disorders and white cell disorders such as leukemia, leukemia, and other conditions. For the past many years, there has been a significant advance in blood cell analysis, which has shifted from manual procedures to automated instruments, providing more precise and reliable results.2
The complete hematological report is mainly based on the CBC generated by the automated analyzer and peripheral smear examination by microscopy. The CBC is a basic and routine test ordered by the consultant physicians nowadays. It helps evaluate the concentration and gives the number of various cellular components of blood, such as hemoglobin (Hb)%, hematocrit, red cell indices, RBC count with differential count (WBC), platelet count, histograms of RBC, WBC, mean platelet volume, and red cell distribution width (RDW). In recent days, many laboratories have shifted from traditional methods in hematology to automated analyzers and automated data.3
RBC histogram is the diagrammatic representation where there is a symmetrical bell-shaped curve, and it helps in better understanding and interpretation of different types of anemia. But its usefulness is still limited in day-to-day use as the technologists have little knowledge or unaware of it. Only a few laboratory technologists have an understanding of correlation and interpretation.3 Hb distribution width, RDW, and reticulocyte count are the parameters that have gained popularity along with scatter plots and histograms as they provide useful and important information.4–6
Red blood cell (RBC) histograms and RBC indices are very essential for diagnosing and management of anemia. The important diagnostic tool for most of the corporate laboratories is the histograms which help in analyzing the blood films routinely. RBC histograms play a major role in the diagnosis of RBC disorders.7
Anemia causes can be multifactorial in origin. But nutritional deficiency is the most common cause of anemia, and it is due to deficiency of nutrients such as iron, vitamin B12, or folic acid. Other clinical conditions which can also lead to anemia include decreased production of RBCs in disease-causing bone marrow failure and increased destruction of RBCs in clinical conditions leading to hemolysis. Therefore, every patient of anemia should be investigated thoroughly to find out the cause so that the proper treatment can be provided based on the underlying cause. However, there is lack of consistency in the protocols that are followed for the proper screening of anemia.8–10
Regardless of the latest sophisticated automated instruments present today, we still rely on certain manual techniques and follow them. This study was planned and conducted to notice the relationship between the Sysmex XN 1000 hematology autoanalyzer-generated RBC histogram and RBC indices and peripheral smear examinations using human blood samples.
Materials and Methods
The current study was a prospective laboratory-based study conducted for a duration of 5 months between August 2023 and December 2023, which was performed at a rural tertiary care center after obtaining an ethical clearance from the institutional ethical committee. The estimated sample size was 456 calculated based on a 95% confidence interval, a margin of error of 4.5%, and a population proportion of 60% to obtain good results, it was made with a 500 sample size.
Inclusion criteria: All the patients of all age groups diagnosed with anemia as per WHO reference range by the automated analyzer and the peripheral smear were included in the study.
Exclusion criteria: Anemic patients who have received a blood transfusion, inadequate quantity of blood sample (< 3 mL) for automated analyzer and patients having leukocytosis, leukemoid reaction, leukemia, and platelet disorders were excluded from the study.
3mL of venous blood samples were collected in an EDTA vacutainer and processed in the Sysmex XN 1000 five-part differential hematology analyzer for CBC within 1 hour of blood sample collection. Calibration and quality control were performed according to the manufacturer instructions before processing test samples.
The RBC indices and histogram for each patient was recorded from the cell counter and peripheral smear study were done to correlate the RBC size, which was a fully automated five-part differential instrument. Peripheral blood smears (PBSs) were done for all the cases simultaneously, and they were stained with Leishman stain. All the peripheral smears were reported accordingly for the RBC size and shape. We also looked for WBC and platelets. Clinical details of the patient were collected.
All the data obtained were entered into Microsoft Excel data sheet and using SPSS 22 version software, it was analyzed. For qualitative data, Pearson's chi-square test was used as test of significance. Wherever necessary data were represented in the form of bar diagrams and charts. The p-value of <0.05 was considered statistically significant.
Results
A total of 500 cases were included in the study, with the age range ranging from 1 to 93 years. The majority of the cases (17.6%) belonged to the age group between 41 and 50 years. In the study population, the majority were females, which contributed to 576.6% of the total cases. Based on Hb values, cases were further divided into the following categories: mild (Hb <11 g), moderate (Hb 7–10 g%), and severe (Hb <7 g%).
Out of 500 cases, 272 (54.4%) were normocytic-normo-chromic anemia, with a majority of 151 females. 183 (36.6%) cases were reported as microcytic hypochromic anemia, and 27 cases showed macrocytic anemia. Dimorphic anemia was seen in 8 cases, and normocytic hypochromic anemia was reported in 10 cases.
In normochromic normocytic anemia, all the RBC indices (mean corpuscular volume [MCV], mean corpuscular hemoglobin [MCH], mean corpuscular hemoglobin concentration [MCHC], and RDW) were within normal limits. In microcytic hypochromic anemia, MCV and MCH were decreased with increased RDW. Increased MCV and RDW with normal MCH and MCHC were seen in macrocytic anemia. Due to the high degree of anisopoikilocytosis in dimorphic anemia, MCV, MCH, and MCHC were within normal limits, and RDW was increased.
Histogram patterns of all 500 cases were studied, and among these, 265 (53%) cases had a normal curve, 188 (37.6%) cases had a left shift curve, 9 (1.8%) cases had a curve shift to the right, 27 (5.4%) cases had a broad base curve, and 11 (2.2%) had a bimodal curve.
Table 1 shows the importance of histogram and RBC indices in the diagnosis of anemia, and they are almost close to the findings of PBS examination except for the dimorphic anemia.
| Investigation | Normocytic normochromic | Microcytic hypochromic | Macrocytic anemia | Normocytic hypochromic | Dimorphic anemia | Total |
|---|---|---|---|---|---|---|
| Peripheral smear finding | 272 | 183 | 27 | 10 | 18 | 500 |
| RBC indices and histograms | 265 | 188 | 25 | 12 | 10 | 500 |
Abbreviation: RBC, red blood cell.
The RBC histogram patterns that were obtained for each case were well correlated with the peripheral smear and tabulated for statistical analysis, showing a significant association of p < 0.01 (Table 2).
| Peripheral blood smear | Histogram pattern | Total | p-Value | ||||
|---|---|---|---|---|---|---|---|
| Broad base | Bimodal | Left shift | Normal curve | Right shift | |||
| Normocytic normochromic anemia | 0 | 0 | 36 | 235 | 1 | 272 | <0.01 |
| Microcytic hypochromic anemia | 5 | 8 | 150 | 20 | 0 | 183 | |
| Macrocytic anemia | 18 | 0 | 0 | 0 | 9 | 27 | |
| Normocytic hypochromic anemia | 0 | 0 | 0 | 10 | 0 | 10 | |
| Dimorphic anemia | 4 | 2 | 2 | 0 | 0 | 8 | |
| Total | 27 | 10 | 188 | 265 | 10 | 500 | |
Abbreviation: RBC, red blood cell.
Discussion
Anemia is a common health concern all over the world, and in India, there is a high prevalence of anemia. The CBC reports and PBS examination can be used as a first investigation for identifying the type of anemia. The use of automated hematology analyzers and their generated RBC parameters also play a pivotal role in typing the anemia.1
Visual representations, such as the RBC histogram, are very useful for clinicians when compared with quantitative numbers alone. The newer generation of hematology CBC analyzers generates a range of histograms that offer quick, important, and essential information to the treating physician about a patient's blood profile, even before the PBS report is released.11
A histogram is a vertical bar chart that depicts the distribution curve of data and is a graphical representation of relative frequency versus cell size. This provides a visual representation in which the peak of the curve represents the highest measurements of cells with particular morphology, and the area within the curve shows the spread of cells. The histogram is one of the most powerful tools in the analysis of red cell morphology.12,13
It helps compare data containing two variables, which leads to a decision on interpretation at no extra cost. Sometimes, the histogram provides more information than the numerical data generated by the automated analyzer. The automated hematology analyzer displays three types of histograms: RBC, WBC, and platelets, and gives information about RBCs, WBCs, and platelets, their morphology and distribution, and they also reflect on the subpopulation of other cells if they are present.12,13 In this study, we have considered only RBC histograms since they are very important for diagnosing anemia.
The RBC plots generated by the automated CBC hematology analyzer use highly developed sophisticated mechanism to measure the number and the size of RBCs in the blood sample. Y-axis on the histogram depicts the number of cells and the X-axis depicts cell size or cell volume. Based on this, any significant shifts in the normal histogram curve can be made out and diagnosis can be made. The normal curve given by the CBC hematology analyzer is typically a symmetrical and bell-shaped curve and indicates a Gaussian distribution. This normal curve provides the range of MCV between 80 and 100 fL.14,15 If the cell size decreases, the shift of the curve will be toward the left and when there is an increase in cell size, the curve will shift to the right. These directional shifts in the histogram can provide valuable diagnostic insights.14
In our study, RBC histogram showed normal curve in (53.0%) cases, Left shift in (37.6%) cases, Right shift (2%) cases, Bimodal (2%) cases, and Broad base (5.4%) cases and these findings correlated with previous studies (Table 3).16–18
| Histogram | Meena H (2023)16 | Dhakar DK (2023)17 | Agarwal A (2023)18 | Present study |
|---|---|---|---|---|
| Normal curve | 7% | 17.6% | 41% | 53.0% |
| Left shift | 27% | 73% | 36% | 37.6% |
| Right shift | 14% | 4.1% | 7% | 2% |
| Bimodal peak | 14% | 2.3% | 16% | 2% |
| Broad base | 38% | 81.8% | 0 | 5.4% |
Abbreviation: RBC, red blood cell.
Among 500 cases, peripheral smear examination and interpretation were done for all the cases in our study. In our study, it was observed that on peripheral smear study, normocytic normochromic anemia (54.4%) was the most common type followed by microcytic hypochromic anemia, macrocytic anemia, and dimorphic anemia. Similar to the present study, correlated with previous studies conducted by Samly et al,19 61 (55.4%) out of 110 patients had normocytic normochromic anemia, and Agarwal A,18 40 (40%) out of 100 patients had normocytic normochromic anemia. Normocytic normochromic anemia was the most common type of anemia in the present study, and the most common cause of this was acute and chronic blood loss (Table 4).
In the RBC plots generated by automated CBC analyzers, cells with volume ranging from 36 to 250 fL are counted as RBCs. However, if the RBC plots show or start from < 36 fL, it may indicate the presence of small particles such as micro-spherocytes, platelet clumps, large platelets, normoblasts, leukocyte fragments elliptocytes, parasites, and bacteria.11 The MCV and RDW are calculated by the area of peak, that is, 60 to 125 fL.12 Therefore, the RBC distribution curves provide valuable information regarding various types of anemia. In normocytic normochromic anemia, it gives a normal curve (Figs. 1 and 2). If the histogram curves are shifted toward the left, then iron deficiency anemia and p thalassemia trait (Figs. 3 and 4) should be suspected. On the other hand, a histogram with a broad base and a right shifted curve may indicate macrocytic anemia (Figs. 5 and 6).15
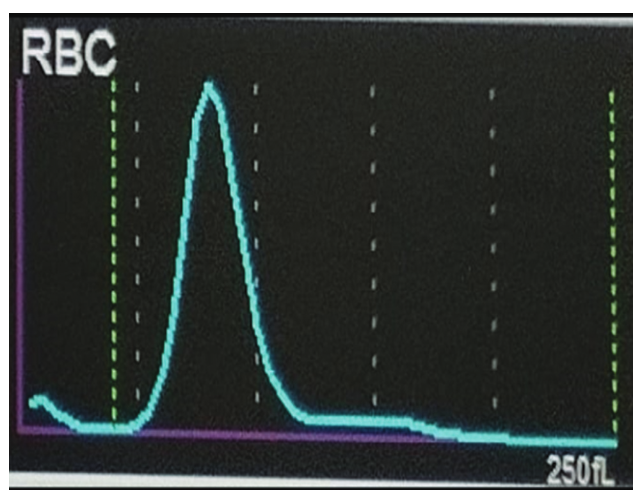
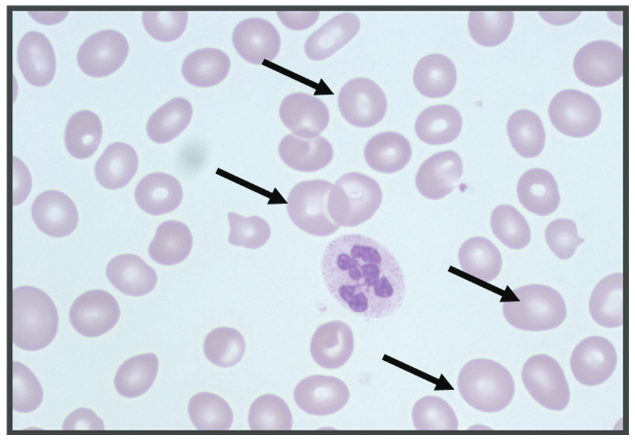
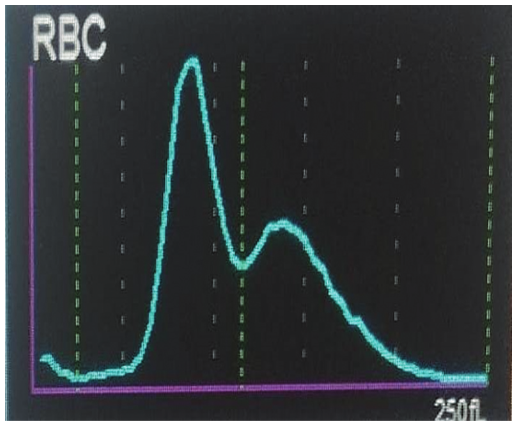
- Normal histogram curve—normocytic normochromic anemia. RBC, red blood cell.
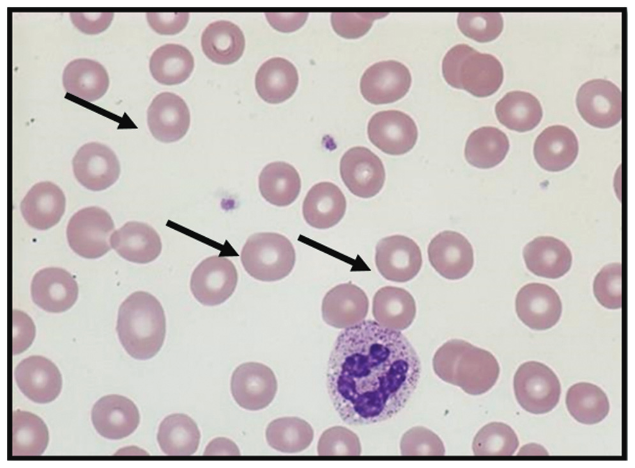
- Peripheral blood smear—normocytic normochromic anemia; black arrows indicate normocytic red blood cell (RBC) (Leishman stain × 1,000).

- Left shift histogram—microcytic hypochromic anemia.
- Peripheral smear—microcytic hypochromic anemia (Leishman stain × 1,000); black arrows indicate microcytes.
- Shift to rights histogram—macrocytic anemia. RBC, red blood cell.
- Peripheral smear—macrocytic anemia (Leishman stain × 1,000); black arrows indicate macrocytes.
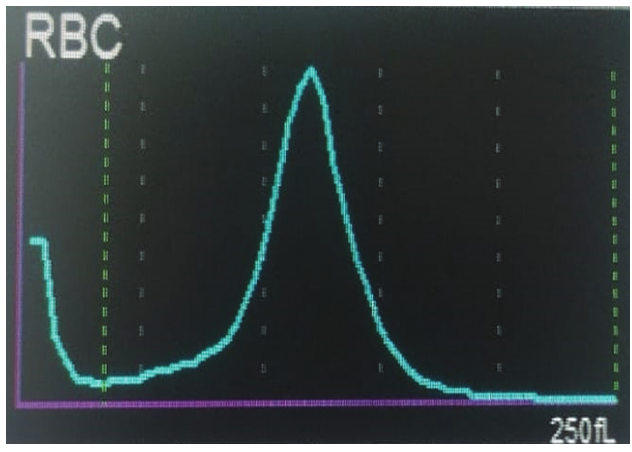
In cases where a patient has hemolytic anemia with schistocytes or received a multiple blood transfusion or has a cold agglutinin disease where varying cell sizes are seen, a bimodal distribution curve is obtained due to the presence of two distinct populations of RBCs (Figs. 7 and 8). In such cases, combining the RBC histogram along with numerical values of RBC count, Hb, hematocrit, MCH, MCHC, and RDW can be of significant diagnostic value.
- Bimodal histogram—dimorphic anemia. RBC, red blood cell.
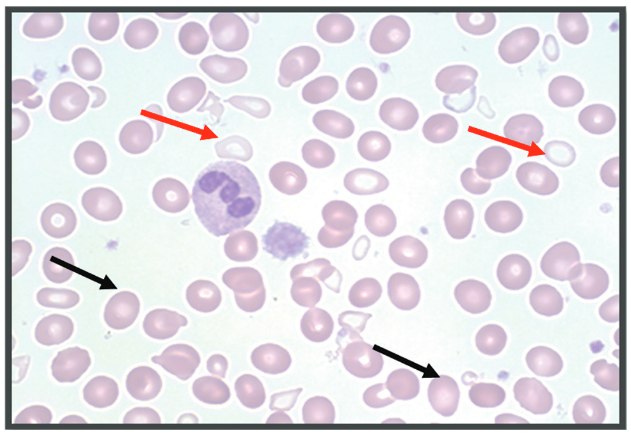
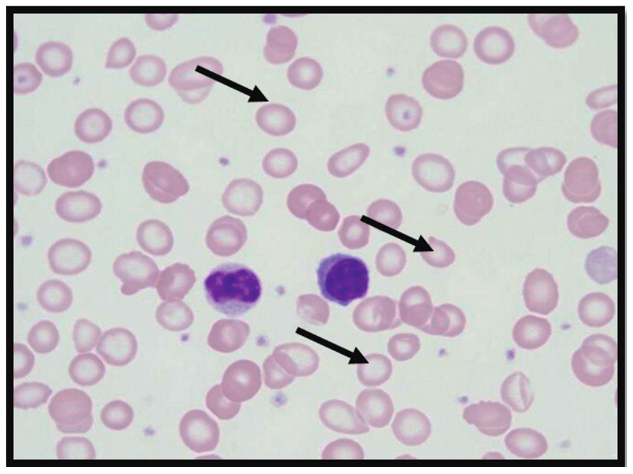
- Peripheral smear—dimorphic anemia (Leishman stain × 1,000); black arrows indicate macrocytes and red arrows indicate microcytes.
All the 500 cases of anemia were analyzed separately by peripheral smear interpretation and RBC histogram pattern, and the correlation between peripheral smear study and automated RBC histograms in various anemia showed a statistically significant association of p < 0.01.
Since the CBCs generated by automated analyzers are now the mandatory instrument in most laboratory settings and are less time-consuming, emergency PBS analysis can be avoided in cases where the RBC parameters point to a definitive diagnostic category of anemia. With the use of automated CBC hematology analyzers, the diagnostic validity and precision have improved, and it also reduces subjective errors. In cases where the clinical profile is indicative of specific categories, PBS examination is mandatory as the role of automated analyzers in such conditions is limited.20
When the RBC indices in different anemia are significantly deranged and when it is correlated with RBC histograms, both will lead to a specific diagnosis of anemia and help in further treatment accordingly. Borderline or slightly abnormal values do not cause a visible shift of the RBC histogram and in such instances, peripheral smear examination becomes mandatory.20
Almost all types of anemia on peripheral smear examination correlated with the RBC indices and histogram patterns so that early treatment can be initiated and also other further investigations can be done accordingly.
Conclusion
The red cell plots and histograms generated by the automated CBC hematology analyzer provide valuable information and help in the diagnosis of various RBC disorders. When the proper interpretation of the curve is paired with other findings such as RDW, red cell indices, and PBS findings, the RBC histogram becomes a very useful diagnostic tool.
Histograms along with blood indices and peripheral smear examination will guide us about RBC morphology. Tentative or interim diagnosis of fragments of RBC in the blood such as microcytic, macrocytic, or dimorphic red cells can be made on peripheral smear, but when this is combined with RBC indices and as well as histograms, it will help us give a confirmatory diagnosis.
Conflict of Interest
None declared.
References
- Comparison of cyanmethemo-globin method and digital haemometer in measuring haemoglobin. Int J Med Biomed Stud. 2019;3(05):66-70.
- [Google Scholar]
- Atlas and Text of Hematology Vol 65. (4th ed.). India: Avichal Publishing Company; 2018.
- Red cell cytograms generated by an ADVIA120 automated hematology analyzer: characteristic patterns in common hematological conditions. Lab Med. 2009;40(09):549-555.
- [Google Scholar]
- Rapid identification of iron deficiency in blood donors with red cell indexes provided by Advia 120. Transfusion. 2005;45(01):5-10.
- [Google Scholar]
- Mijusković Z Reticulocyte hemoglobin content in the diagnosis of iron deficiency anemia. Clin Lab. 2004;50(7–8):431-436.
- [Google Scholar]
- Comparison of automated analyzer generated red blood cell parameters and histogram with peripheral smear in the diagnosis of anemia. Int J Contemp Med Res. 2019;6(08):111-116.
- [Google Scholar]
- Investigation of pediatric anemia in the Commonwealth of the Northern Mariana Islands. Matern Child Health J. 2019;23(03):416-421.
- [Google Scholar]
- Risk factors for recurrent severe anemia among previously transfused children in Uganda: an age-matched case-control study. BMC Pediatr. 2019;19(01):27-31.
- [Google Scholar]
- Hemoglobin Measurement (HEME) Working Group. Measurement and interpretation of hemoglobin concentration in clinical and field settings: a narrative review. Ann N Y Acad Sci. 2019;1450(01):126-146.
- [Google Scholar]
- Interpretation of histograms and its correlation with peripheral smear findings. J Evol Med Dent Sci. 2017;6(60):4417-4420.
- [Google Scholar]
- Principle of blood cell counter- development of electric impedance method. Sysmex J Int. 1999;9(01):8-20.
- [Google Scholar]
- The red cell histogram and the dimorphic red cell population. Lab Med. 2011;42(05):300-308.
- [Google Scholar]
- RBC histogram as supplementary diagnostic tool with peripheral smear examination in evaluating anemia. Ann Pathol Lab Med. 2017;4:66-72.
- [Google Scholar]
- Correlation of automated cell counter RBC histograms and peripheral smear in anemia typing. Asian J of Med Sci. 2023;14(02):127-31.
- [Google Scholar]
- A comparative study of red cell histogram along with CBC parameters and peripheral blood smear in various anemias. Indian J Pathol Oncol. 2023;10(02):156-162.
- [Google Scholar]
- Comparative study of automated cell counter histogram and peripheral blood smear in diagnosis of anemia. Indian J Appl Res. 2023;13(03):5-7.
- [Google Scholar]
- Comparison of hematological parameters with peripheral smear in anemia. International J Clini Diag Pathol. 2019;2(01):92-95.
- [Google Scholar]
- Comparative study of anemia cases based on peripheral blood smears and cell counter generated red cell indices. Int J Sci Res. 2020;9(12):32-34.
- [Google Scholar]