

Translate this page into:
T2 Mapping of Articular Cartilage of the Adult Knee Joint: Changes in the Relaxation Time and Thickness of Knee Cartilage with Age among Normal Adult Patients in 3 Tesla MRI
Address for correspondence Manna Debnath, M.Sc., Bapubhai Desaibhai Patel Institute of Paramedical Sciences, Charotar University of Science and Technology, Off. Nadiad - Petlad Rd, Changa, Gujarat 388421, India (e-mail: mannadebnath93@gmail.com).
This article was originally published by Thieme Medical and Scientific Publishers Pvt. Ltd. and was migrated to Scientific Scholar after the change of Publisher.
Abstract
Background
Degenerative joint disease, such as osteoarthritis, is characterized by the breakdown of cartilage in the joints, resulting in a decreased range of motion and stiffness. The T2 mapping approach is a very useful tool for detecting early osteoarthritis. The main goal of the study was to assess the variations in the relaxation time and articular cartilage thickness of knee cartilage across different age groups among healthy adults using the T2 mapping technique in 3 Tesla magnetic resonance imaging.
Methods
A total of 42 measurements were taken from each individual's knee cartilage and were confirmed to have no cartilage damage. The relaxation time was calculated from T2 maps using 21 circular regions of interest and the articular cartilage thickness was measured using 21 linear measurements from a self-created fusion image. The thickness was measured in the same regions where the relaxation time was measured. Overall, 2,142 measurements (1,071 circular regions of interest from T2 maps and 1,071 linear measurements from fusion images) were taken from 51 participants.
Results
The majority of the variables of T2 relaxation time show a positive linear correlation with age groups. As age increases, cartilage relaxation time increases, which may be connected to an increase in cartilage degeneration. However, half of the variables associated with knee cartilage thickness show a negative linear correlation with age group. As age increases, the thickness of the cartilage starts to decrease. T2 relaxation times of the middle lateral tibial condyle, middle superior patella, and central inferior patella differ significantly between healthy males and females (p < 0.05). The cartilage thickness of the posterior lateral tibial condyle, middle medial patella, central superior patella, central middle patella, and lateral middle patella varied significantly between healthy males and females (p < 0. 05).
Conclusion
Using an additional T2 articular cartilage mapping sequence to a routine sequence in the knee joint can reveal age-related changes in relaxation time and cartilage thickness in knee cartilage. The T2 mapping technique also can help detect early changes in osteoarthritis, track progression, and plan treatment.
Keywords
knee articular cartilage
T2 mapping
relaxation time
healthy adults
3 Tesla magnetic resonance imaging

Introduction
The articular cartilage is one of the primary structures affected by osteoarthritis (OA) and plays a significant role in degenerative diseases of knee joints.1 Knee OA is a chronic rheumatic disease that is the leading cause of disability in the majority of countries throughout the world. OA is the most frequently occurring joint disease in India with a prevalence of 22 to 39%.2,3 Arthroscopy is an invasive procedure and also the gold standard for detecting degenerative abnormalities in the cartilage.4 However, it is an invasive procedure and expensive for patients. On the other hand, magnetic resonance imaging (MRI) is a noninvasive imaging modality and is the imaging modality of choice for diagnosing cartilage-related abnormalities. Conventional MRI allows us to observe the morphological changes in the cartilage that occur during the final stages of OA. Conventional MRI imaging is less sensitive to detecting biochemical changes associated with OA.4,5 Regular MRI protocol for the knee can only detect structural alterations, such as cartilage volume loss and articular cartilage thinning. However, biochemical changes that include proteoglycan and collagen matrix damage and changes in the orientation of the collagen and articular cartilage hydration take place before morphological degeneration of the cartilage.1,6
In India, there are very few noninvasive imaging-based clinical techniques available to assess the early changes in the articular cartilage of the knee. T2 relaxation time mapping is one of the advanced quantitative MRI techniques and a validated MRI image biomarker that is sensitive to water molecules and can detect the biochemical changes in the cartilage of the knee joint.1,4,7 There is a very limited number of studies reported in India in which T2 relaxation time and thickness are measured using 3 Tesla (3T) MRI.8 Moreover, the study's uniqueness lies in the formation of a protocol using MapIt sequences, which has never been reported in this population for assessing cartilage health in normative samples. There are other clinical applications of the MapIt sequence, including aortic valve disease, myocardial infarction, cardiomyopathy, recurrence of hepatocellular carcinoma, and cartilage transplant evaluation, etc.9–12 Furthermore, one of the significant distinctive approaches is used in developing manual fusion images for evaluating cartilage thickness. Additionally, the knee joint was divided into 21 subcompartments, which allowed for a more detailed and comprehensive assessment of the knee articular cartilage condition compared with previous studies. The techniques utilized in this study will provide new insights into their practicality and application in diverse populations. Most of the time cartilage degeneration and thinning are part of the aging process and generally occur when age increases.13 So our main focus of the study was to evaluate the changes in the T2 relaxation time and thickness of knee cartilage using 3T MRI with different age groups.
Methods
This cross-sectional study was conducted in the Department of Radiodiagnosis, Pramukhswami Medical College and Shree Krishna Hospital, Karamsad, Gujarat, India. Ethical approval was obtained from the Institutional Ethical Committee (IEC approval no. IEC/BU/137/Faculty/17/83/2022) to perform the present study. Participants were selected and informed consent was obtained from all the participants. A total of 51 adult patients were included in the study and were divided into three age groups: 18 to 30,31 to 45, and 46 years and above. The study's data collection was performed between July 2022 and August 2023.
Inclusion and Exclusion Criteria
Patients who were referred to the Department of Radiodiagnosis, Pramukhswami Medical College and Shree Krishna Hospital, Karamsad for MRI scan of the knee joint for any knee-related complaint were included in this study. On the other hand, patients with big complex fractures involving the knee joints were excluded. Additionally, patients who refused to sign the informed consent form even after properly explaining about the MRI scan, patients with a history of metallic implants in knee joint, and patients who are claustrophobic to MRI scans were excluded from this research study.
Magnetic Resonance Image Acquisition
Participants were imaged in the supine position with feet first using Siemens Spectra 3 Tesla MRI. During the scanning, a 15-channel knee coil was used around the knee to acquire the raw data. Once the patient positioning was complete, a standard knee protocol including the T2 anatomical sequence was performed. The scanning protocol for the T2 cartilage mapping sequence are as follows: TR 1470 ms, TE 13.8, 27.6, 41.4, 55.2, 69.0 ms, slice thickness 3.0 mm, matrix 320 × 320. The acquisition time for the T2 mapping sequence was approximately 3 to 4 minutes. Color-coded T2 maps were obtained in a sagittal plane using a T2-weighted multislice multiecho sequence (MapIt) to qualify the spatial distribution of T2 relaxation times.
Image Analysis of Articular Cartilage
The relaxation time in different compartments of the knee cartilage is measured using a total of 21 regions of interest (ROIs) (which include the patella, femoral condyle, and tibial condyle cartilage). T2 relaxation time was calculated using color-coded T2 images. Circle ROI was selected from the tool section to measure the relaxation time of the knee cartilage (Figs. 1 and 2). The relaxation time of the knee cartilage was measured as milliseconds. Following that, a fusion image is created using the T2 anatomical sequence and color-coded T2 maps to measure the cartilage thickness. On the sagittal image, using the freehand ROI, all the cartilages were carefully drawn and the thickness was assessed (21 linear measurements) in the same regions where the relaxation time was measured (Figs. 3 and 4). The thickness of the knee cartilage was tabulated as millimeters. All the postprocessing of the image was done in the Siemens Syngo MR Acquisition workplace.
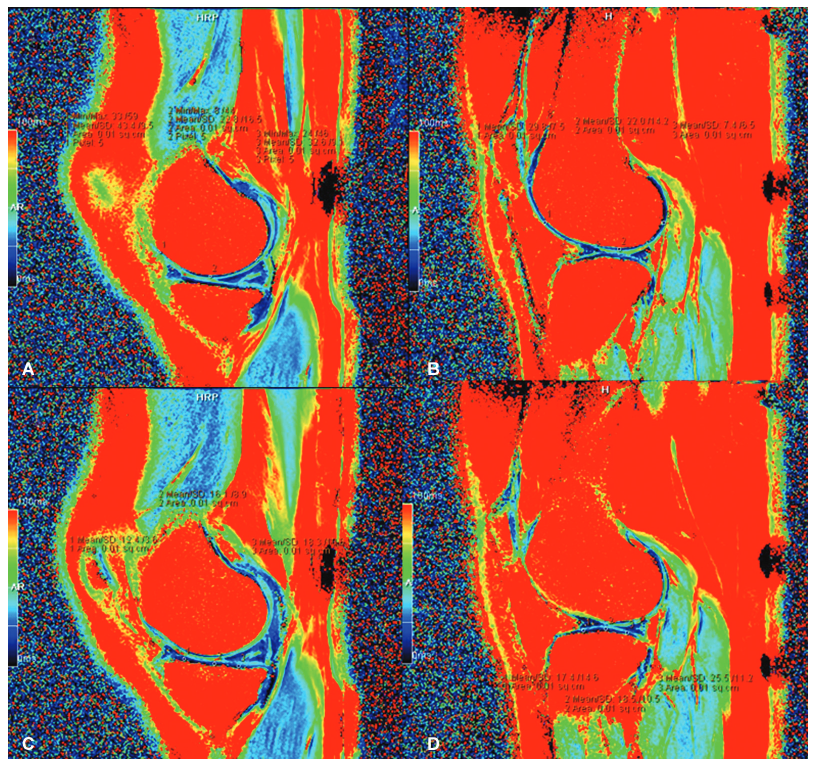
- Circular region of interest (ROI) of relaxation time at (A) medial femoral condyle: (1) anterior medial femoral condyle (AMFC); (2) middle medial femoral condyle (MMFC); and (3) posterior medial femoral condyle (PMFC). (B) Lateral femoral condyle: (1) anterior lateral femoral condyle (ALFC); (2) middle lateral femoral condyle (MLFC); and (3) posterior lateral femoral condyle (PLFC). (C) Medial tibial condyle: (1) anterior medial tibial condyle (AMTC); (2) middle medial tibial condyle (MMTC); and (3) posterior medial tibial condyle (PMTC). (D) Lateral tibial condyle: (1) anterior lateral tibial condyle (ALTC); (2) middle lateral tibial condyle (MLTC); and (3) posterior lateral tibial condyle (PLTC).
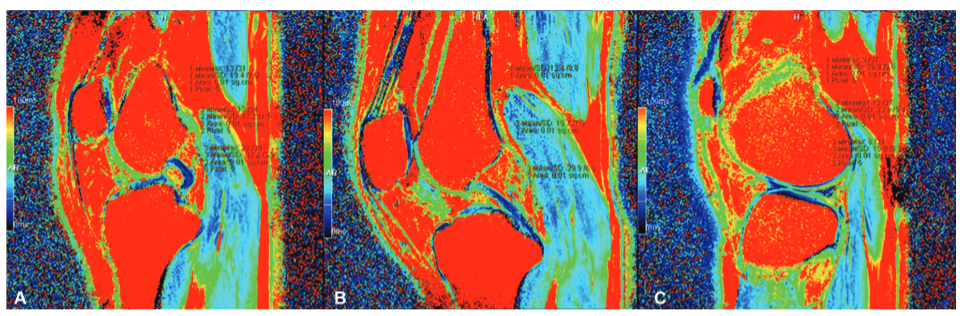
- Circular region of interest (ROI) of relaxation time at (A) medial patella: (1) superior medial superior patella (MSP); (2) medial middle patella (MMP); and (3) medial inferior patella (MIP). (B) Central patella: (1) central superior patella (CSP); (2) central middle patella (CMP); and (3) central inferior patella (CIP). (C) Lateral patella: (1) lateral superior patella (LSP); (2) lateral middle patella (LMP); and (3) lateral inferior patella (LIP).
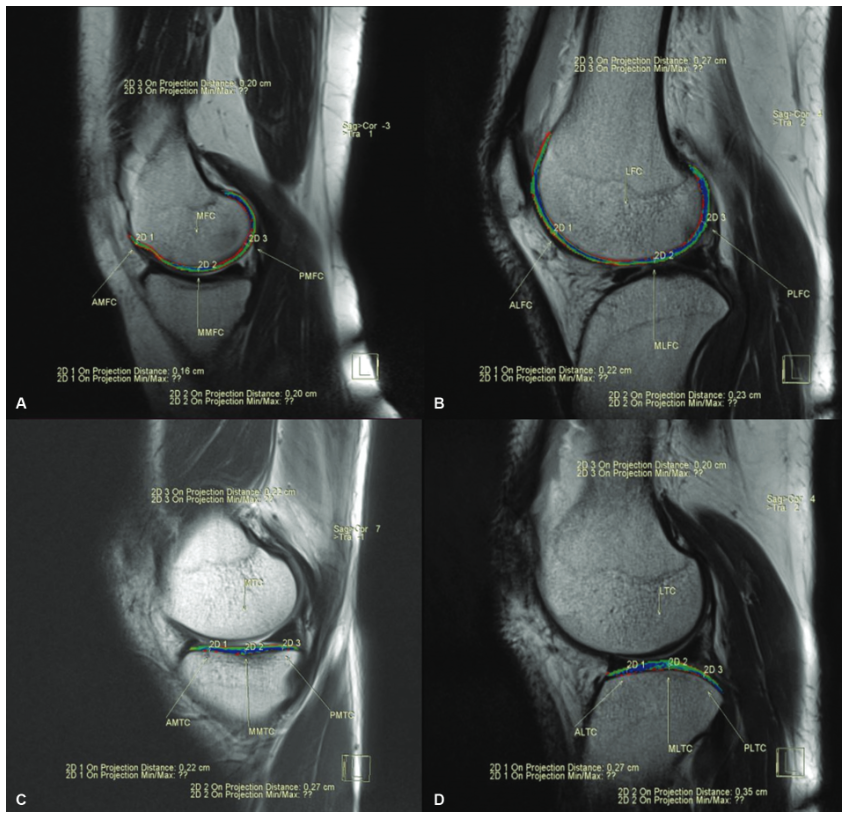
- Fusion image of the (A) medial femoral condyle (MFC) to measure the thickness: labeled as, 2D 1, anterior medial femoral condyle (AMFC); 2D 2, middle medial femoral condyle (MMFC); 2D 3, posterior medial femoral condyle (PMFC). (B) Lateral femoral condyle (LFC) to measure the thickness: labeled as, 2D 1, anterior lateral femoral condyle (ALFC); 2D 2, middle lateral femoral condyle (MLFC); 2D 3, posterior lateral femoral condyle (PLFC). (C) Medial tibial condyle (MTC) to measure the thickness: labeled as, 2D 1, anterior medial tibial condyle (AMTC); 2D 2, middle medial tibial condyle (MMTC);
2D 3, posterior medial tibial condyle (PMTC). (D) Lateral tibial condyle (LTC) to measure the thickness: labeled as, 2D 1, anterior lateral tibial condyle (ALTC); 2D 2, middle lateral tibial condyle (MLTC); 2D 3, posterior lateral tibial condyle (PLTC).
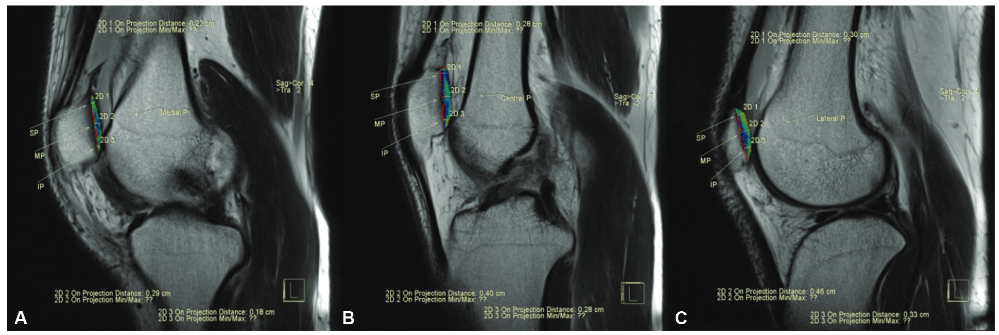
- Fusion image of the (A) medial patella (MP) to measure the thickness: labeled as, 2D 1, medial superior patella (MSP); 2D 2, medial middle patella (MMP); 2D 3, medial inferior patella (MIP). (B) Central patella (CP) to measure the thickness: labeled as, 2D 1, central superior patella (CSP); 2D 2, central middle patella (CMP); 2D 3, central inferior patella (CIP). (C) Lateral patella (LP) to measure the thickness: labeled as, 2D 1, lateral superior patella (LSP); 2D 2, lateral middle patella (LMP); 2D 3, lateral inferior patella (LIP).
Statistical Analysis
The data analysis was done by using descriptive statistics of mean and standard deviation. The normality of the data was assessed by using the Kolmogorov-Smirnov (K-S) tests. The K-S tests show all the data are normally distributed so we opt for the parametric test. The independent sample t-test was used to establish the mean difference in T2 relaxation time and articular cartilage thickness between males and females. Furthermore, Pearson's correlation coefficient was used to identify the strength and direction of the relationship between T2 relaxation time and cartilage thickness with age groups. A p-value of less than 0.05 was considered statistically significant. The data analysis was conducted using IBM SPSS Statistics for Windows, version 26.0.
Results
The study included 51 individuals who underwent the MRI knee scan and were confirmed to have no cartilage damage with an overall mean age of38.25 ± 13.83 years. Out of which 19 were females and 32 were males, with a mean age of 40.32 ± 11.29 years and 37.03 ± 15.18 years, respectively. The descriptive statistics of 42 variables (including 21 T2 relaxation time and 21 articular cartilage thickness) were reported, which shows the mean and standard deviation (Table 1).
| Variables, knee joint cartilage | T2 relaxation time of cartilage n 51 | Articular cartilage thickness n 51 | ||||||
|---|---|---|---|---|---|---|---|---|
| Min. (ms) | Max. (ms) | Mean | Standard deviation | Min. (mm) | Max. (mm) | Mean | Standard deviation | |
| AMFC | 16.4 | 48.8 | 35.23 | 6.99 | 0.8 | 2.0 | 1.51 | 0.30 |
| MMFC | 8.8 | 43.4 | 22.38 | 8.33 | 0.8 | 2.6 | 1.64 | 0.40 |
| PMFC | 4.6 | 47.2 | 31.18 | 10.84 | 1.0 | 2.3 | 1.61 | 0.31 |
| ALFC | 9.0 | 45.0 | 28.48 | 9.11 | 1.1 | 2.4 | 1.67 | 0.37 |
| MLFC | 6.8 | 46.4 | 27.77 | 9.93 | 1.2 | 2.8 | 1.69 | 0.37 |
| PLFC | 12.6 | 43.2 | 28.11 | 7.54 | 1.3 | 2.8 | 1.79 | 0.37 |
| AMTC | 3.6 | 22.5 | 13.15 | 4.77 | 1.6 | 3.1 | 2.11 | 0.30 |
| MMTC | 7.0 | 27.8 | 14.13 | 5.14 | 1.5 | 3.5 | 2.41 | 0.36 |
| PMTC | 6.0 | 34.2 | 20.53 | 7.27 | 1.3 | 3.0 | 2.03 | 0.33 |
| ALTC | 6.8 | 29.6 | 13.80 | 5.00 | 1.7 | 3.5 | 2.35 | 0.35 |
| MLTC | 8.7 | 30.0 | 15.74 | 4.79 | 2.0 | 4.6 | 3.16 | 0.57 |
| PLTC | 8.2 | 41.4 | 20.25 | 7.23 | 1.7 | 3.1 | 2.24 | 0.36 |
| MSP | 10.0 | 50.4 | 29.71 | 8.97 | 1.3 | 3.2 | 1.98 | 0.40 |
| MMP | 7.2 | 45.6 | 25.15 | 10.19 | 1.3 | 4.6 | 2.64 | 0.73 |
| MIP | 7.4 | 46.0 | 24.40 | 8.71 | 1.3 | 3.3 | 2.18 | 0.50 |
| CSP | 2.6 | 31.4 | 16.89 | 6.76 | 1.3 | 3.0 | 2.26 | 0.40 |
| CMP | 6.6 | 31.2 | 18.43 | 6.11 | 1.2 | 5.0 | 2.93 | 0.71 |
| CIP | 2.0 | 38.6 | 19.69 | 9.53 | 1.0 | 3.1 | 2.17 | 0.48 |
| LSP | 2.6 | 38.0 | 20.99 | 9.57 | 1.4 | 3.1 | 2.24 | 0.45 |
| LMP | 1.8 | 36.4 | 17.46 | 7.26 | 1.1 | 4.6 | 2.97 | 0.73 |
| LIP | 4.0 | 42.6 | 17.89 | 8.86 | 1.0 | 3.2 | 2.16 | 0.46 |
Abbreviations: ALFC, anterior lateral femoral condyle; ALTC, anterior lateral tibial condyle; AMFC, anterior medial femoralcondyle; AMTC, anterior medial tibial condyle; CIP, central inferiorpatella; CMP, central middle patella; CSP, central superior patella; LIP, lateral inferior patella; LMP, lateral middle patella; LSP, lateral superior patella; MIP, medial inferiorpatella; MLFC, middle lateral femoralcondyle; MLTC, middle lateral tibial condyle; MMFC, middle medial femoral condyle; MMP, medial middle patella; MMTC, middle medial tibial condyle; MSP, medial superior patella; PLFC, posterior lateral femoral condyle; PLTC, posterior lateral tibial condyle; PMFC, posterior medial femoral condyle; PMTC, posterior medial tibial condyle.
The present study shows that the lateral middle patella has a minimum T2 relaxation time of 1.8 ms and the anterior medial femoral condyle has a maximum T2 relaxation time of 48.8 ms. Similarly, the overall mean T2 relaxation value ranges from 13.15 ± 4.77 on the anterior medial tibial condyle to 35.23 ± 6.99 on the anterior medial femoral condyle (Table 1).
Both the anterior and middle medial femoral condyles have a minimum cartilage thickness of 0.8 mm and the central middle patella (CMP) has a maximum cartilage thickness of 5.0 mm. The overall mean cartilage thickness value ranges from 1.51 ± 0.30 on the anterior medial femoral condyle to 3.16 ± 0.57 on the middle lateral tibial condyle (Table 1).
The relaxation time of the middle lateral tibial condyle, medial superior patella, and central inferior patella show statistically significant differences in T2 relaxation time in healthy males and females (p < 0.05) (Table 2). The articular cartilage thickness of posterior lateral tibial condyle, medial middle patella, central superior patella, CMP, lateral middle patella, and lateral inferior patella (LIP) showed statistically significant differences in cartilage thickness in healthy males and females (p < 0.05) ( Table 2)(Supplementary Tables S1 and S2, online only).
| Variables, knee joint cartilage | T2 relaxation time of cartilage | Articular cartilage thickness | ||||
|---|---|---|---|---|---|---|
| Male, n 32 | Female, n 19 | p-Value | Male, n 32 | Female, n 19 | p-Value | |
| Mean SD (ms) | Mean SD (mm.) | |||||
| AMFC | 34.16 7.87 | 37.04 4.86 | 0.16 | 1.55 0.29 | 1.44 0.31 | 0.21 |
| MMFC | 21.01 7.94 | 24.68 8.68 | 0.13 | 1.68 0.34 | 1.58 0.48 | 0.40 |
| PMFC | 29.13 10.88 | 34.62 10.13 | 0.08 | 1.65 0.29 | 1.55 0.34 | 0.28 |
| ALFC | 28.94 9.10 | 27.71 9.33 | 0.65 | 1.69 0.36 | 1.64 0.40 | 0.65 |
| MLFC | 28.23 11.16 | 26.98 7.62 | 0.67 | 1.68 0.40 | 1.70 0.33 | 0.89 |
| PLFC | 27.05 7.23 | 29.91 7.89 | 0.19 | 1.81 0.41 | 1.75 0.28 | 0.62 |
| AMTC | 12.43 4.23 | 14.37 5.48 | 0.16 | 2.14 0.30 | 2.07 0.29 | 0.46 |
| MMTC | 13.83 5.03 | 14.64 5.43 | 0.59 | 2.41 0.36 | 2.42 0.36 | 0.89 |
| PMTC | 21.99 6.70 | 18.08 7.71 | 0.06 | 2.02 0.31 | 2.06 0.38 | 0.69 |
| ALTC | 13.63 4.45 | 14.08 5.94 | 0.76 | 2.37 0.35 | 2.30 0.36 | 0.48 |
| MLTC | 14.55 3.51 | 17.73 6.00 | 0.02a | 3.26 0.60 | 2.99 0.48 | 0.10 |
| PLTC | 19.72 6.17 | 21.14 8.85 | 0.51 | 2.32 0.36 | 2.11 0.31 | 0.04a |
| MSP | 27.51 8.36 | 33.43 8.93 | 0.02a | 2.02 0.43 | 1.92 0.33 | 0.36 |
| MMP | 23.45 10.00 | 28.02 10.13 | 0.12 | 2.84 0.76 | 2.31 0.57 | 0.01a |
| MIP | 23.17 7.31 | 26.48 10.56 | 0.19 | 2.26 0.51 | 2.03 0.46 | 0.11 |
| CSP | 15.70 6.36 | 18.89 7.11 | 0.10 | 2.35 0.35 | 2.09 0.43 | 0.02a |
| CMP | 18.40 5.47 | 18.50 5.47 | 0.96 | 3.12 0.69 | 2.62 0.65 | 0.01a |
| CIP | 17.23 9.07 | 23.85 9.04 | 0.02a | 2.22 0.48 | 2.08 0.49 | 0.34 |
| LSP | 19.40 9.77 | 23.67 8.82 | 0.12 | 2.31 0.47 | 2.12 0.39 | 0.14 |
| LMP | 16.16 6.58 | 19.65 7.97 | 0.10 | 3.17 0.61 | 2.64 0.81 | 0.01a |
| LIP | 16.30 6.81 | 20.56 11.23 | 0.10 | 2.26 0.45 | 2.00 0.45 | 0.05a |
Abbreviations: ALFC, anterior lateral femoral condyle; ALTC, anterior lateral tibial condyle; AMFC, anterior medial femoral condyle; AMTC, anterior medial tibial condyle; CIP, central inferior patella; CMP, central middle patella; CSP, central superior patella; LIP, lateral inferior patella; LMP, lateral middle patella; LSP, lateral superior patella; MIP, medial inferior patella; MLFC, middle lateral femoral condyle; MLTC, middle lateral tibial condyle; MMFC, middle medial femoral condyle; MMP, medial middle patella; MMTC, middle medial tibial condyle; MSP, medial superior patella; PLFC, posterior lateral femoral condyle; PLTC, posterior lateral tibial condyle; PMFC, posterior medial femoral condyle; PMTC, posterior medial tibial condyle; SD, standard deviation.
The majority of the variables of the tibiofemoral and patellar regions show a positive linear correlation with age groups, which means that with increasing age, the relaxation time of the cartilage also increases and this increase in relaxation time may be linked to an increase in cartilage damage. In the tibiofemoral regions, the relaxation time of the posterior lateral femoral condyle showed a strong statistically significant difference with the age group of 18 to 30 years (p < 0.05) and also posterior medial femoral condyle (PMFC) showing strong statistically significant difference with the age group of 46 years and above (p < 0.05). On the other hand, in the patellar regions, the relaxation time of the LIP showed a strong statistically significant difference with the age group of 18 to 30 years (p < 0.05) and also the CMP showing strong statistically significant difference with the age group of 31 to 45 years (p < 0.05) (Supplementary Table S3, online only).
Almost more than half of the variables in the tibiofemoral regions of cartilage thickness show a negative linear correlation with age groups, which means as age increases the cartilage thickness of the tibiofemoral regions starts to decrease. Out of all the variables, the correlation with the age group of 18 to 30 years and the thickness of the anterior left femoral condyle (p < 0.05) shows a strong statistically significant difference. Although in the patellar region, there was no statistically significant difference observed, but the majority of the patellar regions of cartilage thickness showed a negative correlation, which means as the age increases the cartilage thickness of the patellar regions starts to decrease (Supplementary Table S4, online only).
Discussion
MRI is the preferred modality of choice for evaluating cartilage degradation.14 Quantitative T2 mapping is one of the various evaluation techniques used for cartilage assessment. The T2 relaxation time is a highly sensitive metric that can be used to assess changes in tissue anisotropy, collagen, and water con-tent.6,15 The main purpose of the study was to evaluate the changes in the T2 relaxation time and the thickness of knee cartilage using 3T MRI with different age groups.
Alsayyad et al conducted a study based on adding a T2 mapping sequence in which they included 20 healthy groups with a mean age of 34.8 ± 10.30 years. They also reported that the mean T2 values of the control group is 39.3 ± 10 ms and the mean cartilage thickness of the control group is 2.0 ± 0.6 mm.16 Another study by Zhao et al, conducted a study in which 28 volunteers were included with an average age of 27.0 ± 3.4 years. Out of the 28 volunteers, 12 were males and 16 were females with an average age of 26.8 ± 3.4 and 27.1 ± 3.5 years, respectively.17 In our present study, we have included 51 individuals with no cartilage damage with a mean age almost similar to the above studies, that is, 38.25 ± 13.83 years. Out of the 51 individuals, 19 were females and 32 were males, with a mean age of 40.32 ± 11.29 and 37.03 ± 15.18 years, respectively.
A study reported that the T2 value of patellar cartilage was lower as compared with the femoral cartilage and in tibial cartilage, T2 values were higher in the central and posterior region.17 Similar results were found in our study (Table 1). When talking about compartmental analysis, our data also showed that the mean T2 value of the medial femoral condyle (T2 values: 29.60 ms) was higher than the lateral femoral condyle (T2 values: 28.12 ms). In the tibial cartilage, the average value of the medial tibial condyle (T2 values: 15.94 ms) was lower than those of the lateral tibial condyle (T2 values: 16.59 ms). In the patellar cartilage, the mean relaxation time of the medial patella (T2 values: 26.42 ms) was higher, followed by the lateral patella (T2 values: 18.78 ms) and the central patella (T2 values: 18.34 ms). The maximum T2 relaxation time in our study is 48.8 ms, which is almost similar to the previously reported data.18,19
Compartmental analysis of articular cartilage thickness of the knee joint showed that the mean cartilage thickness of the medial femoral condyle (1.59 mm) was lower than the lateral femoral condyle (1.72 mm). However, in tibial cartilage, the mean cartilage thickness of the medial tibial condyle (1.72 mm) was higher than the lateral tibial condyle (2.58). The lateral patellar condyle (2.46 mm) showed higher mean thickness as compared with the central patellar (2.45 mm) and medial patella (2.27 mm).
Verschueren et al revealed that sex had no effect on T2 relaxation time for age-dependent subgroups or the overall population.18 Similar findings were also reported by Mosher et al, that no correlation was found between sex and T2 relaxation time.19 However, a previous study conducted by Joseph et al reported a weak correlation between sex and T2 relaxation time in the OA initiative population with no signs of radiographic OA.20 In our present study, to establish the mean difference in T2 relaxation time and articular cartilage thickness between males and females the independent sample t-test was used. Our findings indicate that the T2 relaxation times of the middle lateral tibial condyle, medial superior patella, and central inferior patella show statistically significant differences in T2 relaxation time between healthy males and females (p < 0.05). The cartilage thickness of posterior lateral tibial condyle, medial middle patella, central superior patella, CMP, lateral middle patella, and LIP also showed statistically significant differences in articular cartilage thickness between healthy males and females (p < 0.05).
Pearson's correlation coefficient (r) is used to measure the linear correlation of the variables in different age groups. The value of the Pearson's correlation ranges from −1 to +1, which measures the strength and direction of the association between the variables. There is a significant positive correlation between the variables if the Pearson's correlation value is close to +1, and a strong negative correlation between the variables if the value is close to −1. In our study, the Pearson's correlation was conducted to identify the relationship between T2 relaxation time and cartilage thickness of different age groups. Few previous studies reported that a steady increase in T2 relaxation time was observed with aging in the adult population.21,22 Mosher et al also reported an increase in T2 relaxation time in the patella after more than 45 years and an elevation of T2 value involved with the deeper layer of cartilage after the age of 65 years.22 Verschueren et al conducted a study on 109 patients and found that T2 relaxation times have a substantial positive correlation with age.18 In the present study, the tibiofemoral cartilage and posterior lateral femoral cartilage showed a significant difference (p < 0.05) in T2 relaxation time compared with the 18 to 30 age group. The PMFC showed a significant difference (p < 0.05) in T2 relaxation time among those aged 46 and above. The T2 relaxation time in patellar cartilage differed significantly (p < 0.05) with the LIP (18–30 years) and CMP (31–45 years) groups. Overall, the tibiofemoral and patellar cartilage showed a moderate positive connection with the age groups, which suggests that the relaxation time of the cartilage increases with increasing age, and an increase in relaxation time is associated with cartilage deterioration and disorganization.23–26
Kim et al conducted a study based on age and sex dependency of cartilage T2 relaxation value using 1.5T MRI among children and adolescents and reported that there is a significant decrease in the articular cartilage thickness with increasing age. A similar study has been reported by Span-now et al with ultrasonic measurements. Additionally, they reported that the cartilage of males was thicker than that of females.7,27 In the present study, anterior lateral femoral condyle showed a significant difference (p < 0.05) in cartilage thickness compared with the 18 to 30 age group. However, no significant difference was observed in tibial and patellar cartilage thickness but there is a moderate negative correlation. Overall, a moderate negative linear correlation was observed in the tibiofemoral and patellar cartilage, which suggests that with increasing age the cartilage thickness of the knee joint starts to decrease, and the majority of the subcompartments suggested that male cartilage is thicker than that of females (Table 2). So the present study concluded that adding the T2 mapping sequence along with the MRI knee routine protocol could be a game changer to rule out the changes in the T2 relaxation time and thickness of knee cartilage with different age groups.
Limitations
The main limitation of our study is that neither histological examination nor arthroscopy was used as a standard reference for assessing knee articular cartilage. Other technological limitations include the fact that we did not evaluate the superficial and deep layers of cartilage separately because our system does not have such postprocessing tools. The third and final limitation was during participant selection, the biochemical stress was not considered, which might have led to selection bias.
Conclusion
In the present research, the thickness of the cartilage in the majority of the variables of the tibiofemoral and patella was shown to be greater in males than in females. The study found an overall moderate positive association of T2 relaxation time in different age groups, indicating that increasing T2 relaxation time with age can have a major influence on knee cartilage. On the other hand, the study found an overall moderate negative correlation between articular cartilage thickness and age group, indicating that cartilage thickness decreases with age. The study concludes that combining a T2 mapping sequence with a regular protocol could be a useful method for detecting articular cartilage degeneration as human ages.
Acknowledgments
We are thankful to the Pramukhswami Medical College and Shree Krishna Hospital, Bhaikaka University and Bapubhai Desaibhai Patel Institute of Paramedical Sciences (BDIPS), and Charotar University of Science and Technology for their constant support and encouragement.
Ethical Approval
Institutional Review Board approval was obtained from the Institutional Ethics Committee (IEC) of Bhaikaka University (IEC approval no. IEC/BU/137/Faculty/17/83/2022).
Conflict of Interest
None declared.
References
- Advanced compositional imaging T2 mapping sequence in detection of stages of medial knee joint compartments articular cartilage degeneration. Egypt J Radiol Nucl Med. 2021;52(01):1.
- [Google Scholar]
- Epidemiology of knee osteoarthritis in India and related factors. Indian J Orthop. 2016;50(05):518-522.
- [Google Scholar]
- Prevalence and pattern of symptomatic knee osteoarthritis in Nigeria: A community-based study. Internet J Allied Health Sci Pract. 2009;7(03):10.
- [Google Scholar]
- Quantitative MRI in the evaluation of articular cartilage health: reproducibility and variability with a focus on T2 mapping. Knee Surg Sports Traumatol Arthrosc. 2014;22(06):1385-1395.
- [Google Scholar]
- The accuracy of magnetic resonance imaging scanning and its influence on management decisions in knee surgery. Arthroscopy. 2009;25(05):473-480.
- [Google Scholar]
- Age and sex dependency of cartilage T2 relaxation time mapping in MRI of children and adolescents. AJR Am J Roentgenol. 2014;202(03):626-632.
- [Google Scholar]
- T1 and T2 mapping of articular cartilage and menisci in early osteoarthritis of the knee using 3-Tesla magnetic resonance imaging. Pol J Radiol. 2019;84:e549-e564.
- [Google Scholar]
- Evaluation of knee joint cartilage through T2 mapping technique by magnetic resonance.
- T1 mapping: basic techniques and clinical applications. JACC Cardiovasc Imaging. 9:67-81.
- [Google Scholar]
- T2 and T2* mapping in patients after matrix-associated autologous chondrocyte transplantation: initial results on clinical use with 3.0-Tesla MRI. Eur Radiol. 20:1515-1523.
- [Google Scholar]
- T mapping on gadoxetic acid-enhanced MR imaging predicts recurrence of hepatocellular carcinoma after hepatectomy. Eur J Radiol. 2018;103:25-31.
- [Google Scholar]
- Effect of age on thickness of adult patellar articular cartilage. Ann Rheum Dis. 1977;36(06):563-568.
- [Google Scholar]
- Cartilage MRI T2 relaxation time mapping: overview and applications. Semin Musculoskelet Radiol. 2004;8(04):355-368.
- [Google Scholar]
- Role of adding T2 mapping sequence to the routine MR imaging protocol in the assessment of articular knee cartilage in osteoarthritis. Egypt J Radiol Nucl Med. 2021;52:1-9.
- [Google Scholar]
- T2 mapping for knee cartilage degeneration in young patients with mild symptoms. BMC Med Imaging. 2022;22(01):72.
- [Google Scholar]
- T2 relaxation times of knee cartilage in 109 patients with knee pain and its association with disease characteristics. Acta Orthop. 2021;92(03):335-340.
- [Google Scholar]
- Effect of gender on in vivo cartilage magnetic resonance imaging T2 mapping. J Magn Reson Imaging. 2004;19(03):323-328.
- [Google Scholar]
- A reference database of cartilage 3 T MRI T2 values in knees without diagnostic evidence of cartilage degeneration: data from the osteoarthritis initiative. Osteoarthritis Cartilage. 2015;23(06):897-905.
- [Google Scholar]
- Human articular cartilage: influence of aging and early symptomatic degeneration on the spatial variation of T2-preliminary findings at 3 T. Radiology. 2000;214(01):259-266.
- [Google Scholar]
- Age dependency of cartilage magnetic resonance imaging T2 relaxation times in asymptomat?ic women. Arthritis Rheum. 2004;50(09):2820-2828.
- [Google Scholar]
- Quantitative MRI using T1p and T2 in human osteoarthritic cartilage specimens: correlation with bio?chemical measurements and histology. Magn Reson Imaging. 2011;29(03):324-334.
- [Google Scholar]
- T1rho, T2 and focal knee cartilage abnormalities in physically active and sedentary healthy subjects versus early OA patients-a 3.0-Tesla MRI study. Eur Radiol. 2009;19(01):132-143.
- [Google Scholar]
- Quantitative MRI techniques of cartilage composition. Quant Imaging Med Surg. 2013;3(03):162-174.
- [Google Scholar]
- Effects of unloading on knee articular cartilage T1 rho and T2 magnetic resonance imaging relaxation times: a case series. J Orthop Sports Phys Ther. 2012;42(06):511-520.
- [Google Scholar]
- Ultrasonographic measurements of joint cartilage thickness in healthy children: age- and sex-related standard reference values. J Rheumatol. 2010;37(12):2595-2601.
- [Google Scholar]